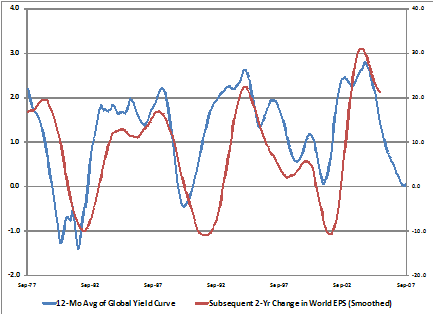
A very interesting article by William Hester includes this chart and discussion:
Changes in World EPS have tracked the shape of the global yield curve closely, usually with about a two-year lag. The global yield curve was inverted from 1979 until 1982. The smoothed World EPS eventually declined by 10 percent. The global yield curve inverted again in 1990, and World EPS declined by a similar amount. In 2001 when the smoothed yield curve flattened, but didn't invert, World EPS again declined by more than 10 percent. The 12-month moving average of the yield curve spread hit zero in July. It has since ticked up a fraction, as short rates have fallen in response to the world-wide credit crisis.
Much like the pattern in U.S. data, year-over-year changes in World EPS have very little correlation with the short-term returns of the MSCI World price index. But the current flatness of the global yield curve may turn out to be important. That's because more extended declines in World earnings have correlated with important declines in MSCI's World price index.
As the chart above shows there have been three meaningful declines in smoothed World earnings, bottoming in 1982, 1991, and 2001. Using monthly data, the smoothed Global Yield Curve bottomed in November 1981, May 1990, and April 2001. The corresponding declines in the MSCI World price index from those points were -17.3 percent, -19.4 percent, -35.0 percent, respectively (the peak-to-trough market losses were even worse).
No comments:
Post a Comment