Hussman ;
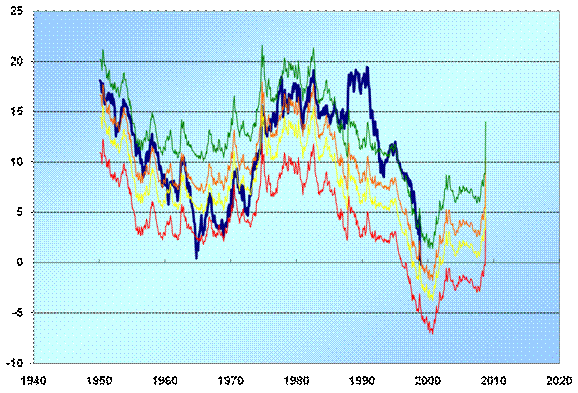
Long-term shareholders will recognize the following chart, which is an update of our 10-year total return projections for the S&P 500 Index ( standard methodology ). The heavy line tracks actual 10-year total returns. Note that the total return for the past decade has been zero, right in the mid-range of what we projected at the time. The green, orange, yellow, and red lines represent the projected total returns for the S&P 500 assuming terminal valuation multiples of 20, 14 (average), 11 (median) and 7 times normalized earnings. Stocks are now at the same valuations that existed at the 1990 bear market low. Relative to 30-year Treasury yields, the S&P 500 is priced to deliver the highest excess return since the early 1980's.
2 comments:
so, does this mean it is a good time to buy an S&P fund?
I do not favor index purchases here. We could be in a very long period of only modest gains in markets, if any.
Look for big solid high dividend yielding stocks that you can be confident will survive; Pfizer, Altria, Gen Elec, etc. Also corporate bond yields are absurdly high right now so a good closed ind bond fund bought at high discounts available last week and probably this coming week too are very attractive.
Post a Comment