Bill Gross of Pimco the manager of the largest bond fund in the world has recently ( and rightly) been ranting about Washington and the failure to deal with the US debt buildup. Most recently Pimco has discussed the stock market and "money illusion". I wrote a short note on what he meant. Available here:
Showing posts with label SP 500. Show all posts
Showing posts with label SP 500. Show all posts
Tuesday, April 26, 2011


Monday, April 5, 2010
Jeff Saut weekly for April 5
Jeff Saut of Raymond James this week:
Remember Roosevelt's programs required a devaluation of the dollar. Devaluations devastate the savings of the middle class.
Ladies and gentlemen, we don’t have a tax shortfall problem; we have aThe market has rebounded on massive stimulus but the piper will be repaid some years down the road.
government spending problem. As the Washington Times writes, “For the
first time since the Great Depression Americans took more aid from their
government than they paid in taxes.” Manifestly, our government is
becoming an increasing “spender” in the economy and that should worry
you. Indeed, a recent study from the sharp-sighted folks at the GaveKal
organization shows what occurred in the United Kingdom when the
government became an increased “spend” in that economy. By examining the
nearby chart:

Remember Roosevelt's programs required a devaluation of the dollar. Devaluations devastate the savings of the middle class.
Friday, November 20, 2009
Don Coxe Nov 20
Thanks to Prieu du Plessis
here is Mr. Coxe
Update: fixed link so I hope it works now. Hat tip to Patrick
here is Mr. Coxe
Update: fixed link so I hope it works now. Hat tip to Patrick
Saturday, August 15, 2009
Wednesday, August 12, 2009
Wednesday, April 29, 2009
Melt up?
Every once in a long while the market tone gets very bearish and individuals and institutions become so cautious they maintain a very defensive portfolio and carry lots of near cash positions rather than stay fully invested. Sometimes the market then begins to rise for no apparent reason. Usually descriptions like bear market rally, or correction, or pause are used to explain the action and not many jump on board the upward move. But the market keeps crawling upward and institutional fund managers find themselves underperforming the market for a quarter. Then for a part of a second quarter they still stay out they fall further behind and start to get a little nervous, but earnings season is coming and the market moves a little sideways. The fund managers are reassured the bear will resume or at least weak earnings will give them a sharp correction they can use to get on board.
But lo and behold the earnings period doesn't break the market and a crappy GDP number not only doesn't break the trend but buyers drive the market up sharply and a month in to the second quarter these fund managers really are way behin with less than 8 months to catch up and get ahead of the market. Now jobs are on the line. Soon the "Melt up" begins. An overbought overstretched rally turns into a frenzy as fund managers capitulate on their bearish ideas and buy in with waves of panicky buy orders. The market shoots far further than is justified in a fairly short period of time till the funds are more properly positioned for and up move. And just as suddenly the bull is over, vanished, gone like the wind. The bear resumes.
In 35 years in the market I have seen this once or twice. I think we may see it again very, very soon.
Be careful out there!

But lo and behold the earnings period doesn't break the market and a crappy GDP number not only doesn't break the trend but buyers drive the market up sharply and a month in to the second quarter these fund managers really are way behin with less than 8 months to catch up and get ahead of the market. Now jobs are on the line. Soon the "Melt up" begins. An overbought overstretched rally turns into a frenzy as fund managers capitulate on their bearish ideas and buy in with waves of panicky buy orders. The market shoots far further than is justified in a fairly short period of time till the funds are more properly positioned for and up move. And just as suddenly the bull is over, vanished, gone like the wind. The bear resumes.
In 35 years in the market I have seen this once or twice. I think we may see it again very, very soon.
Be careful out there!
Thursday, April 16, 2009
Thanks to Jim Paulsen.
I received the Monthly Perspective from Jim Paulsen at Wells Capital Management and had the great pleasure to read the following portion:
I have been expecting this to be a big point of conversation around the forecasting crowd but until Jim's report I had not heard a single mention of this issue. Times have certainly changed. I guess we really have become an instant gratification society.
You can read Jim Paulsen's report here, please note I will not be posting Wells Capital Management reports here since you should be contacting the company for these, but, since I quoted it and Jim is an analyst I admire I am posting just this one.
Many believe traditional economic policies have not worked in this crisis. However, despite potential mistakes made by U.S. policy officials (and each will painstakingly be studied for years to come), its resolution is nonetheless finally emerging “because” ofpolicy official actions! Wall Street has stabilized since November only because of massive monetary, interest rate and fiscal stimulus introduced since last summer!I have been pontificating to the young guys at my firm in my role as macro strategist that the media was contributing to the problem of pessimism by demanding immediate results from monetary and fiscal stimulus. Always in the past the rule of thumb was monetary stimulus took 6 to 12 months to produce any real results and therefore no one should even expect to see much from all those programs until at least March and probably a little later. So I continued, don't expect much good news till then but some surprises should begin to occur around the end of the first Qtr giving us a chance of a rally.
Since last August, the real M2 money supply has risen at a postwar high annualized growth rateclose to 20 percent! Short-term interest rates have been driven essentially to zero! The yieldcurve has been spectacularly steep! Mortgage rates have plummeted to at least a four-decade low!Finally, federal deficit spending in the seven months since August is in excess of $900 billion!
Despite widespread perceptions these policies were not working, within three months, these massively stimulative economic policies began to stabilize Wall Street in November. And even though policies often take as much as a year before they begin to show noticeable impact on the economy, signs of economic stabilization are already emerging.
I have been expecting this to be a big point of conversation around the forecasting crowd but until Jim's report I had not heard a single mention of this issue. Times have certainly changed. I guess we really have become an instant gratification society.
You can read Jim Paulsen's report here, please note I will not be posting Wells Capital Management reports here since you should be contacting the company for these, but, since I quoted it and Jim is an analyst I admire I am posting just this one.
Wednesday, April 1, 2009
Review of 1st quarter
I decided to take a look at the first quarter compared to my expectations at the beginning of 2009.
I have posted my document on SCRIBD but I am still trying to learn how to use it. If you have problems please note in a comment so I will know to fix it.
I have posted my document on SCRIBD but I am still trying to learn how to use it. If you have problems please note in a comment so I will know to fix it.
Ouroborous Review Mch 2009.
Wednesday, March 25, 2009
23% Bounce? Where?

Upon returning from vacation I find a 23% bounce off of the lows in the SPY. can anyone see it? This chart courtesy of CQG.
Tuesday, January 27, 2009
Tim Price takes lessons from the 30's and Murray Rothbard
Tim Price of The Price Of Everything draws lessons from the great depression and Murray Rothbard in this post.
One exerpt:
One exerpt:
But the savaging of fractional
reserve banking is only a small part of the message of Rothbard’s “America’s
Great Depression”. Contrary to the received wisdom that interventionist
government (under, Rothbard points out, the administration of Herbert Hoover
for some years before Roosevelt took the presidency) ameliorates and
foreshortens a dismal business depression, Rothbard suggests that the very
intervention so clamorously called for (both then and now) actually extends
and amplifies
it:
Tuesday, December 9, 2008
Russell Napier and Tobin's Q Ratio
from Bloomberg:
Update:
Henry Blodgett references the same article but he has a chart! I won't steal it so you better click through.
click here for the rest of the article.By Patrick Rial
Dec. 10 (Bloomberg) -- The 2008 slump in global equities
has further to go if Tobin’s Q ratio is any guide, according to
CLSA Ltd. strategist Russell Napier.The ratio, a method of valuing U.S. companies developed by
Nobel Prize laureate economist James Tobin, indicates that the
Standard & Poor’s 500 Index, set for its worst year since 1931,
may sink by another 55 percent to 400 when the market bottoms
around 2014, London-based Napier said. The ratio divides total
market capitalization by the cost of replacing assets.
Update:
Henry Blodgett references the same article but he has a chart! I won't steal it so you better click through.
Friday, November 28, 2008
Unchartd territory? Not so much.
Blodgett and Hussman on "uncharted Territory".
Go to both links, they cover it better than I would.
Market In "Uncharted Territory"? Only If You're An Idiot
Fund manager John Hussman takes aim at one of the ludicrous excuses that is making its way around Wall Street: All past losses and future uncertainty can be forgiven because the market is in "uncharted territory." Please.
Go to both links, they cover it better than I would.
Wednesday, November 19, 2008

Friday, November 7, 2008
Why stocks maybe are not cheap
from Clusterstock an interesting blog run by the once infamous Henry Blodgett.
It comes down to apples to oranges but I much prefer the oranges to Professor Siegel's apples because he uses forward earnings estimates and they are notoriously unreliable.Jeremy Siegel's Mistake: Why Stocks Are NOT "Dirt Cheap"
Yesterday, we noted that Wharton professor Jeremy Siegel's "fair value" estimate for the S&P 500 is a startling 1380, which is about 40% higher than most other estimates (Robert Shiller, Jeremy Grantham, Andrew Smithers, John Hussman, et al). Prof Siegel, who is now a pitch man for WisdomTree funds, uses this estimate to conclude that stocks are "dirt cheap."
The other experts, meanwhile, who use a consistent, historically predictive, and fully explained methology, estimate that fair value is around 900-1000, about where we are now. In their view, stocks are just fairly valued.
So who's right?
Thursday, October 16, 2008
If you invest I suggest you read Hussman
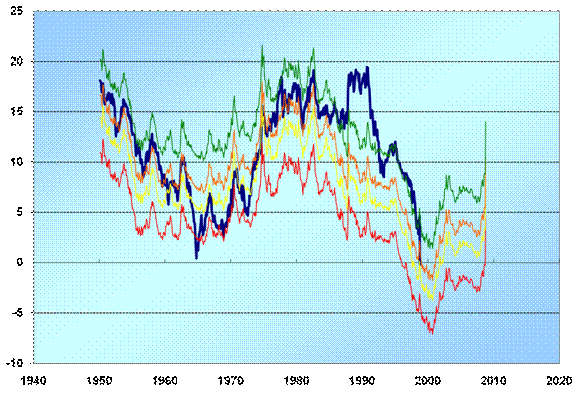
Hussman ;
Long-term shareholders will recognize the following chart, which is an update of our 10-year total return projections for the S&P 500 Index ( standard methodology ). The heavy line tracks actual 10-year total returns. Note that the total return for the past decade has been zero, right in the mid-range of what we projected at the time. The green, orange, yellow, and red lines represent the projected total returns for the S&P 500 assuming terminal valuation multiples of 20, 14 (average), 11 (median) and 7 times normalized earnings. Stocks are now at the same valuations that existed at the 1990 bear market low. Relative to 30-year Treasury yields, the S&P 500 is priced to deliver the highest excess return since the early 1980's.
Saturday, October 11, 2008
Charts from Fullermoney


I am a paid up subscriber of the Fullermoney service and am using some of their charts from Friday. Click the chart for a larger image.
The first chart is the VIX an index measuring volatility conditions in the market. This is the highest level since the index started trading which was after the 87 crash. Estimates of the crash day vol are higher still.
The second chart was sent in by a Fullermoney subscriber and show the current S&P relative to its 200 day moving average. One cannot know how far down this chart could drop but levels this low do usually mark major lows.
Thursday, October 9, 2008

Monday, October 6, 2008

Friday, August 15, 2008


Tuesday, July 15, 2008
Bespoke: naked shorting of stocks.

Bespoke produces this table of stocks believed to be amongst the most heavily shorted. Should Paulsen and Congress successfully restore limits on shorting and enforce the rules against naked shorting these stocks might be vulnerable to a sharp short covering rally.
Update: I wrote this post Tuesday afternoon and then went in today watched the market start to rally said this could get the shorts running and propmtly went back some research I was doing and never pulled the trigger on a share. That Ladies and Gentlemen and Traders is an own goal.
Subscribe to:
Posts (Atom)